
Demand planning
Safety stock and lead time calculations let you forecast customer demand day by day rather than just season by season, so buying decisions are based on evidence, not gut feel.
Decision it enables: how much of each product to buy, and when, to avoid stockouts without tying up cash in excess inventory.
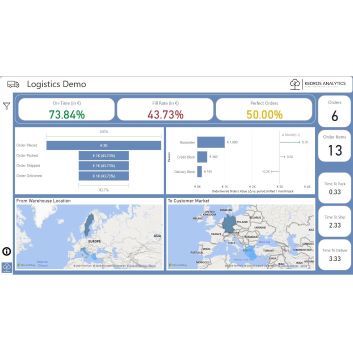
OTIF and Logistics visibility
A live dashboard tracking on-time-in-full (OTIF), fill rate and order cycle time turns scattered carrier and warehouse data into one shared view of service performance, the same approach used to build control towers for large logistics operations.
Decision it enables: which routes, warehouses or 3PL partners are underperforming, and where to intervene first.
View the live Power BI report →Reorder point optimization
A simple model calculates the minimum stock to hold and the exact reorder point per SKU, replacing rules of thumb with numbers grounded in each item's actual demand variability.
Decision it enables: the precise quantity and timing of the next purchase order, SKU by SKU.
Try the free Inventory Control tool →